The Table widget displays a broader view of your data, presenting raw and non-aggregated data in columns, with as much fields and metrics as needed.
Adding Data
-
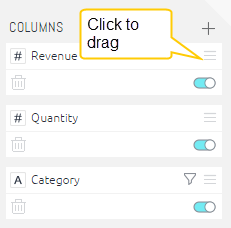
Click Add + to select the field(s) that you want to add to the table.
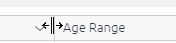
To rearrange the order of the columns, click and drag a column up or down.
Designing the Table Panel
Fine-tune the appearance of the Table widget, using the following tools:
-
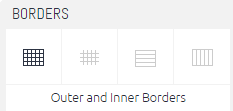
Borders : Select the borders to display in the table.
-
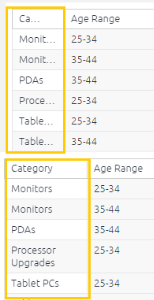
Column Width: You can resize the column widths as follows:
- Fit to Window Size: Columns are resized automatically to fit the contents in the window.
- Fit to Content: You can manually resize the column widths by dragging the column separator.
-
Colours: Select whether to color (highlight) alternating columns and rows, and the table header.
-
Word Wrap: Select whether to wrap texts in headers and rows.
-
Infinite Scroll: Toggle the Infinite Scroll option On or Off:
- On: Include all items in a single page with scrolling. Additional data loads as you scroll down in the page.
- Off: (Default) Specify how many rows you want in a single page. Paging options are displayed above the specified number.