The funnel chart shows stages in a process that are sequentially dependent. The funnel shape helps you track the health or validity of any process, such as progressing ideas independently through a phased challenge.
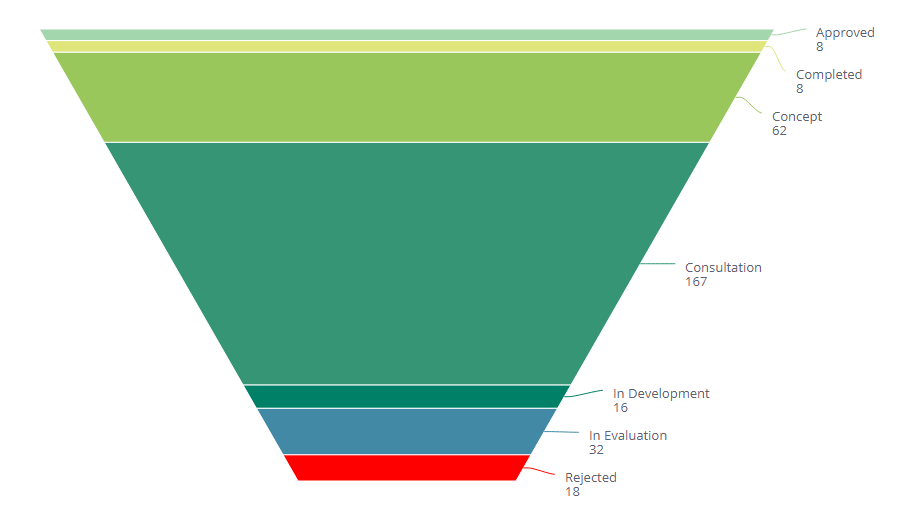
There are two ways to use a funnel chart. You can either pick a category accompanied by a single value, or you can add multiple values. If you pick a category, the value will be broken-by the members of the category and each member is represented by a section within the funnel.
Adding Data
- You can use the Categories panel if you use fields that contain all the steps in the process, click Add + to select the category and the value is represented as stages in the funnel.
- Alternatively, you can click Add + in the Values area to select the individual measures to include in the funnel. Each measure appears as a stage in the funnel.
The fields appear in the same top to bottom order in the funnel as they appear in the panel. Also, the value of the funnel’s top stage is always 100% and the percentage value for each subsequent stage is derived from the top stage.
Designing the Funnel Chart
You can fine tune the appearance of the funnel widget with the following tools.
- Funnel Size: Select the funnel width Wide, Regular (default), and Narrow.
- Funnel Type: Select Pinched to display the last stage as a rectangle so that the funnel looks skinnier at the bottom.
- Funnel Direction: Select Inverted to flip that chart so the first stage is on the bottom and the last stage is on top.
- Legend: Toggle on or off to display the legend and select where it is displayed: Top, Left, Right, or Bottom.
- Labels: Toggle on or off to display the stage labels and select the elements to display.
- Categories: Show (default) or hide the labels for each stage but still display the values for each stage.
- Percent: Show (default) or hide the percentage that each stage represents.
- Values: Show (default) or hide the numerical value of each stage.
- Decimal: Show (default) or hide a decimal value for each percentage. This label only applies when the Percent value is selected.