

Latest Information
The Latest Information data field from the Idea Workflow Table should be used when you wish to show the latest state of an idea. For example to show the latest idea progression action.
Using Count vs Distinct Count
In Power BI, the choice between COUNT and DISTINCT COUNT depends on whether you want to include duplicate values in your total. For example if you use fields from the Idea workflow history – such as progression – and you use count there will be be duplicates so use distinct count instead.
COUNT: Counts every single non-blank row in a column, including duplicate values.
DISTINCT COUNT: Counts each unique value exactly once, completely ignoring duplicates.
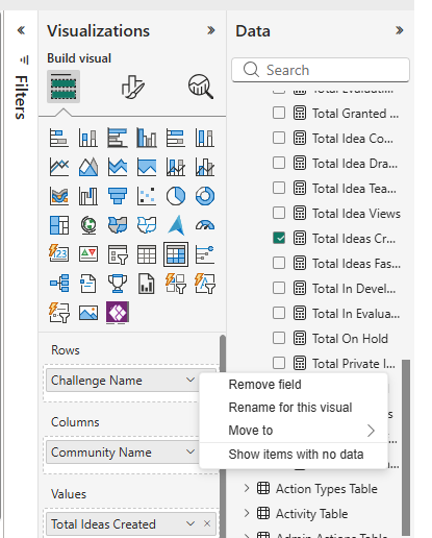
Show items with no data
Use the Power BI Show items with no data feature to display data rows and columns that don’t contain measure data. When you create a visual, Power BI doesn’t display all possible data by default. Instead, Power BI applies a measure to the data and then omits rows and columns that have blank measure values. In certain cases, you might want to display the omitted data.
It can be found in the Visualizations panel when you select the dropdown next to the field name:
Changing Date Formats
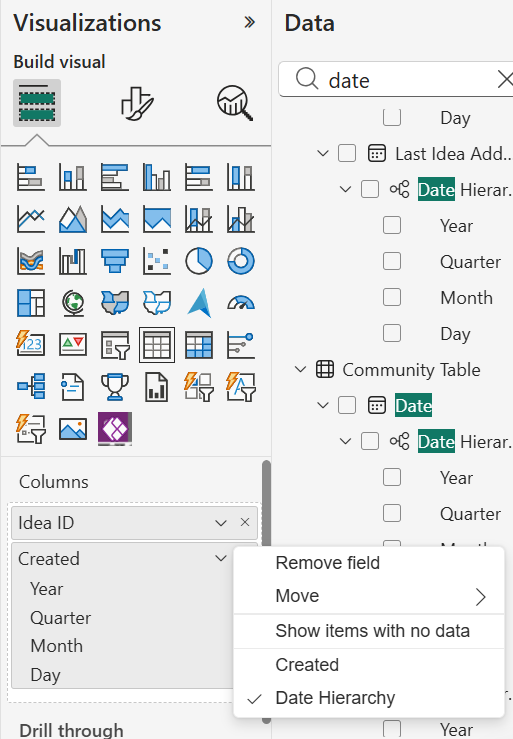
When using date fields there are options for which date format to display. Choose Year, Quarter, Month, Day or Created from the Visualizations panel.
Choose Created to show the day/month/year date of creation. Or choose one of the data Hierarchies if want to just display Year, Quarter, Month or Day.
Adding Tooltips
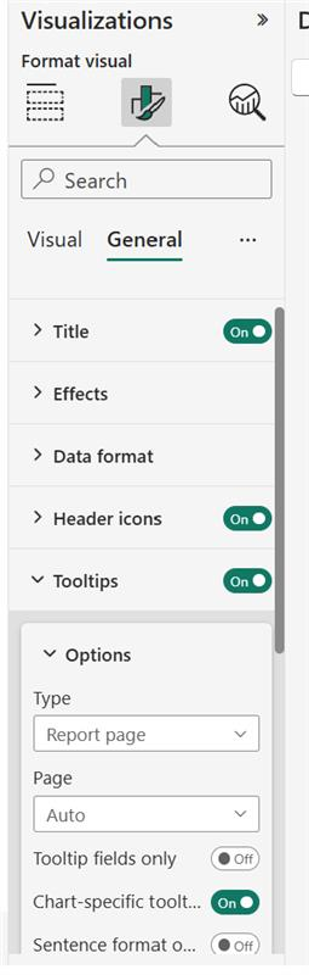
Use the Tooltips setting to add a tooltip to any Visualization. The setting can be found in the Format visual > General menu. Select the visualization you want the tooltip to appear on then select Enable tooltips and enter the tooltip text.
When to use a Matrix Vs Table
Use a Power BI matrix when you need to summarize and compare data across multiple dimensions. For example, as you would use a pivot table in Excel. You can use a matrix to show aggregations (sums, averages) in a compact, cross-tabulated grid. Use a table to display granular row-by-row data without aggregation.
Create a heat map from a Matrix
Once you have your matrix set up follow these steps to apply a “heat map” look to the chart
- Go to Format visual > Cell elements
- Enable Background colour
- Customize the Gradient: Click the fx (Conditional Formatting) icon. Choose a 2-colour or 3-colour gradient
- (Optional) Match Font Colours: Turn on Font colour and apply the same colour gradient. This perfectly blends the numbers into the cells so the colors drive the visualization.
- Under the Format pane, go to Row headers and toggle off Stepped layout for a classic grid appearance.
Using a card visual
The card visual is a great choice for displaying key metrics in a flexible, visually appealing format. Each card shows a measure value with optional callout images, reference labels, and supporting details. You can display multiple cards in a single visual, break them down by categories, and customize layouts to match your report design.
- In the Visualizations pane, select the Build visual tab, then select the Card visual from the visual gallery.
- Add a measure or any data column to the Values field well.
- You can add as many values as you like and more cards appear.
- Multi-card layout: When you have multiple values, this setting controls the arrangement of cards: such as tiles
- The Cards > Layout controls how elements are arranged within each card. Each card can have three sections: callout, image, and reference labels. Use these settings to adjust the positioning, alignment, and spacing of these elements.
Creating a tabbed report using Pages
To organise a report that contains many charts you can add Pages. See the default User Report as an example, there is a Summary page and a User Report page.
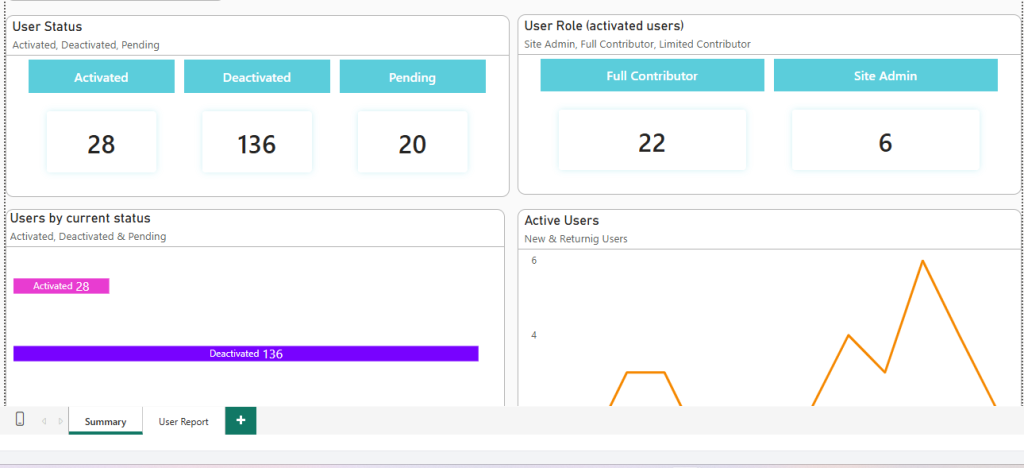
To add a new page select the + icon next to the existing pages. You can rename a page by double clicking or right clicking the current page title. You can choose which page should be the landing page by right clicking and selecting Set as landing page on the correct page.